Vanna, Charm & Gamma
Not quite the greeks you are looking for but the ones you should probably know!
If I had a nickel for everytime somebody looked at me in utmost confusion when I mention about the greeks in the context of what drove the major flows in markets as part of my market update…
I would be a rich! Alas I’m not but in the quest to enrich our portfolios or even to have a greater understanding of markets (maybe even greater confusion..), thought I explain them this week!
Before dwelving into these greeks/flows, its important to note that the change in today’s investing landscape, particularly the greater demand for options.
In a market which is usually structured long, participants often hedge with a combination of Long Puts/Short Calls.
On the other side of this hedging activity are the market makers who are now conversely Short Puts/Long Calls which means that they are net long as expressed in terms of their option delta which is now positive. Market makers often do not wish to express a directional view and in turn need to delta hedge themselves (from postive to zero). The process of this hedging is achieved by shorting the underlying index tied to the option.
So, what are Vanna/Charm/Gamma flows?
Basically these flows are a function of market makers requiring to hedge less as they lean towards option expiry week, allowing them to buy back some of their shorts.
Charm
Charm measures the change in an option’s delta with respect to time or commonly referred to as an option’s decay decay as it inches closer towards it expiry.
Vanna
Have you ever wondered why whenever a widely anticipated event (2020 Election for example!) comes out in line with expectations, VIX is crushed and indices rally? Well, thats Vanna for you!
Vanna measures the change in an option’s delta with respect to implied volatility.
In the context of the 2020 election, its the removal of hedges (namely puts!) as long as the outcome of the event is in line, which decreases the implied volatitlity (as loosely measured by VIX) that allows market makers to buy back the indices it was previously short. Resulting in this VIX down and Stocks Up dynamic.
Gamma
Amongst the greeks, Gamma is undoubtedly the most well known in financial media largely due to the infamous Gamestop and Bed Bath & Beyond squeezes which it was responsible for.
Gamma measures the change in an option’s delta with respect to the underlying price.
In the context of those infamous short squeezes, Gamma is exhibited as follows:
A large market participant namely a hedge fund or activist investor initiates a large OTM call option on said stock.
Market maker is required to buy the underlying stock to remain delta neutral as he would otherwise be short the call option and delta negative.
News breaks out regarding involvement of initial participant, resulting in a herd of investors buying short dated call options which are often cheap to get in on the trade..
Market maker is again required to buy back more stock to delta hedge, resulting in the stock price to surge.
Participants who were previously short the stock at a lower price are now forced to cover or face a margin call, resulting in further buying.
Due to Gamma, the increase in price now increases the said deltas of the previous call options which results in a reflexive loop which forces further short covering and buying back by the market maker.
Option Expiry
So tying it all together with respect to dealer hedging flows, these greeks are amptly surmised below
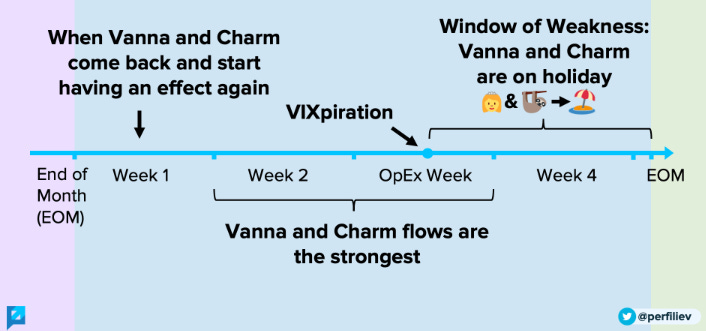
In the context of Option Expiry, Gamma often acts as a dampener/stabillizer for the index while Vanna & Charm act as supportive flows as the deltas of the options inches towards zero as a function of rolling over of VIX term structures (implied vol reduces) and time (time → 0) respectively.
These flows often start around the 1st week of the month till Option Expiry week as shown below:
Beyond Option Expiry week, markets are caught in a window of weakness and are vulnerable to market-moving news. A recent example of this would be the sell off following the news of a new covid variant last year as shown below
Lowdown: Can this be traded?
For sure! Especially from a theoretical perspective given that these flows are fairly systematic. This however requires a wide range of sophisticated data regarding volatility surfaces, skew and dealer positioning which may not be accessible to a retail investor. To trade this blindly would be a fool’s errant as shown below
Rather, the important take away should be the awareness of the windows of weakness upon the conclusion of option expiry that often results in massive moves up and down.


